
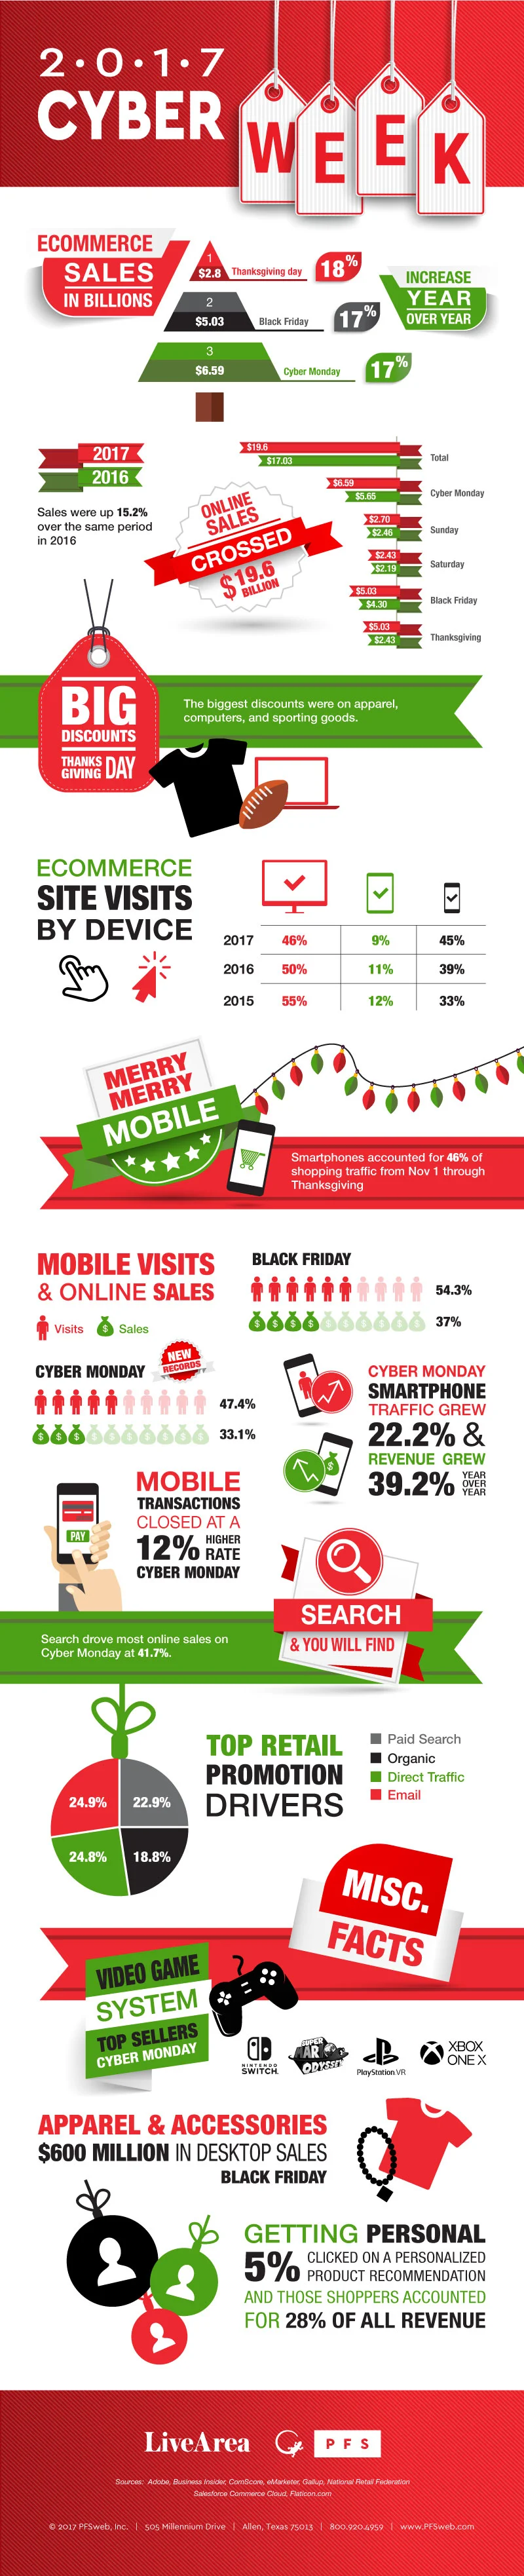

Infographics are always so much fun to create! This particular infographic features the most important stats surrounding sales during Black Friday through Cyber Monday.
When I first receive the data for an infographic I establish a tone from the writing. From there I gather graphics or create what I need while grouping the data into easy-to-digest sections. To grab more attention on social media I created a quick GIF using the top graphics and title.